Checking Spectrum Graphs
Context
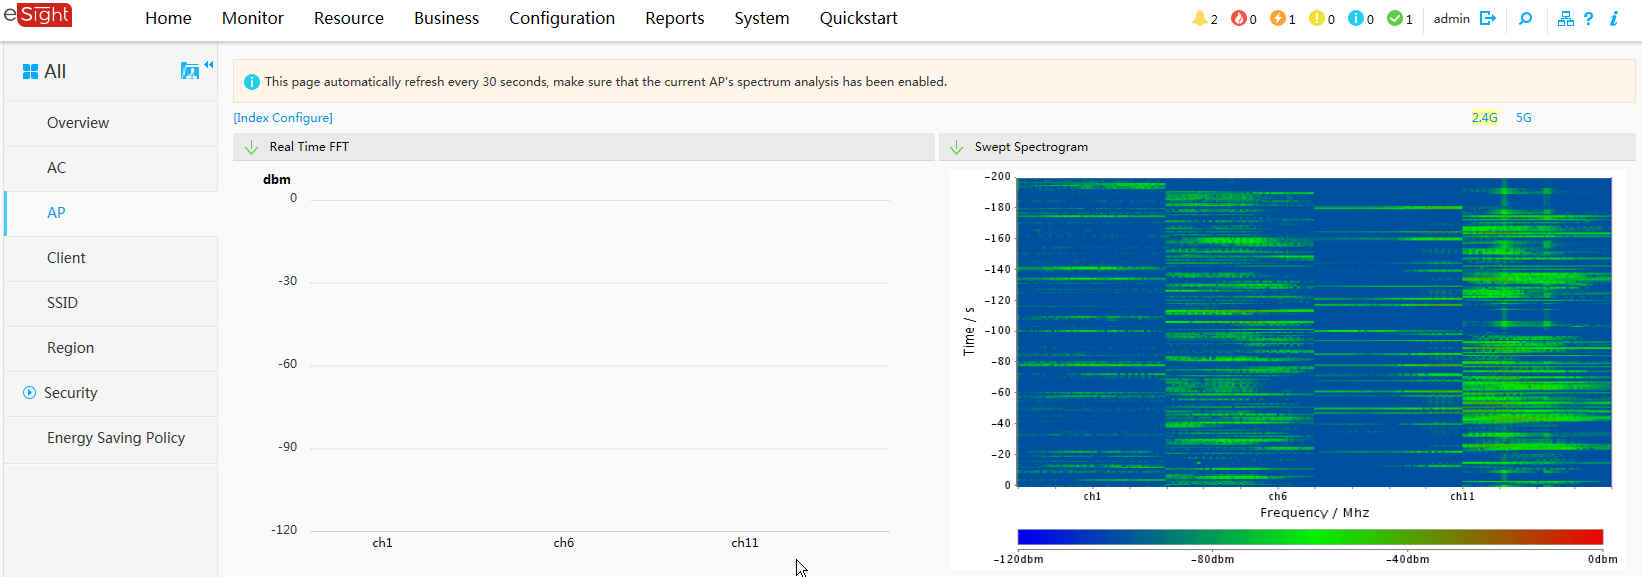
After spectrum analysis is enabled on the AC, you can view AP spectrum on the eSight (V300R003C20) to learn interferences surrounding APs in deployment sites. This helps identify and locate interference devices on the WLAN in a timely manner so that radio calibration can be implemented on the WLAN.

As for dual-band APs, you can view the 2.4 GHz or 5 GHz spectrum graph.
Spectrum graphs include real-time FFT, depth, channel quality, channel quality trend, and device percentage charts.
Procedure
- Choose from the main menu.
- Use either of the following methods to access the region object manager.
- In the monitoring mode, right-click a region in on the left pane, and select .
- In the 360 topology view, click a region name in the region list at the bottom of page to display the object manager of the selected region.
In the region object manager view, you can click to select other regions.
 - Choose from the navigation tree of the Region Object Manager.
- In the AP list, click
 and select in the column.
 - Click , choose a spectrum graph type, and click to view the spectrum graph of the selected AP.