Understanding Spectrum Analysis
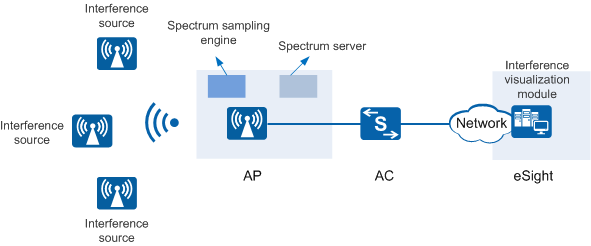
Network Architecture
- Spectrum sampling engine: collects and sends the spectrum information on a wireless network to a spectrum analyzer.
- Spectrum analyzer: analyzes spectrum data, identifies interference source types, and sends the report on interference devices to the interference visualization module.
- Interference visualization module: displays interference source information in graphs, including real-time spectrum graphs.
Principles
Spectrum analysis is implemented as follows:
The AP functions as the spectrum sampling engine to scan and sample the spectrum.
The AP periodically scans the wireless environment.
The AP obtains original spectrum sample data from channel scanning. Each spectrum sample data contains a group of subcarriers used for interference identification.
As a spectrum analyzer, the spectrum analysis module of the AP computes the sample data based on a certain algorithm to identify the non-Wi-Fi devices.
A common algorithm includes pulse signal extraction, pulse signal combining, pulse clustering, extraction of time signature, extraction of frequency characteristics, period calculation, and duty cycle calculation.
After the AP computes the characteristics, it can compare one or more characteristics with the interference source feature database to identify non-Wi-Fi devices.
Currently, the AC can identify Bluetooth devices, microwave ovens, 2.4G cordless phones and cordless bases, ZigBee devices, wireless game controllers, 2.4G/5G wireless video and audio devices, baby monitors, and fixed band devices. Due to differences of individual devices, some of these non-Wi-Fi devices may not be identified.
The AP records the identified devices into the non-Wi-Fi device list, which you can query through command lines or on the web platform. If the type of an identified device is not in the non-Wi-Fi device list, the AP reports an alarm (but will not report the same alarm repeatedly in 10 minutes). If the type of the identified device is already in the list, the AP does not report an alarm.
The AP reports the data to the spectrum drawing server for interference visualization.
The AP can report the data to the spectrum drawing server directly or through the AC. Currently, Huawei only supports the eSight as the spectrum drawing server.
Spectrum Graphs of Non-Wi-Fi Devices
The AP reports the spectrum data to the spectrum drawing server which then displays the data in graphs. Through the spectrum graphs, users can learn channels, interference strength, and types of interference sources in the wireless environments.
The spectrum density determines the frequencies where interference sources are distributed. The signal strength is differentiated by colors. The following paragraphs describe spectrum graphs of typical non-Wi-Fi devices. When analyzing the spectrum graphs, users can identify the interference source types based on the spectrum characteristics.
Typical non-Wi-Fi devices are classified into frequency-hopping devices and fixed-frequency devices.
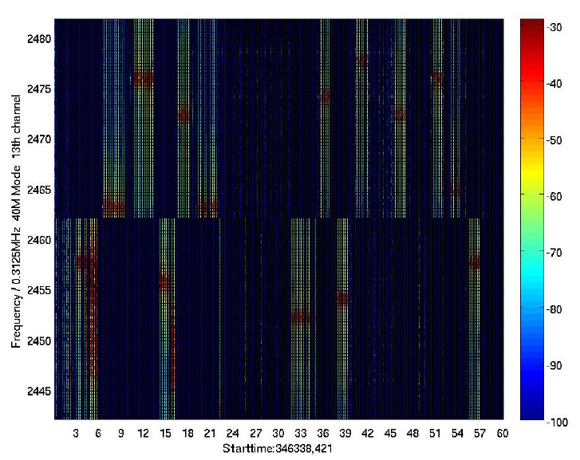
Frequency-hopping devices
Frequency of frequency-hopping devices changes over time. Typical frequency-hopping devices include cordless phones, Bluetooth devices, and game controllers. A Bluetooth device is used as an example here. Figure 2 shows its spectrum graphs (the horizontal axis indicates time whereas the vertical axis indicates frequency). Red squares indicate signals of the Bluetooth device. The Bluetooth device works at the 2465M frequency point at time point [6, 9] and at the 2475M frequency point at time point [9, 12].
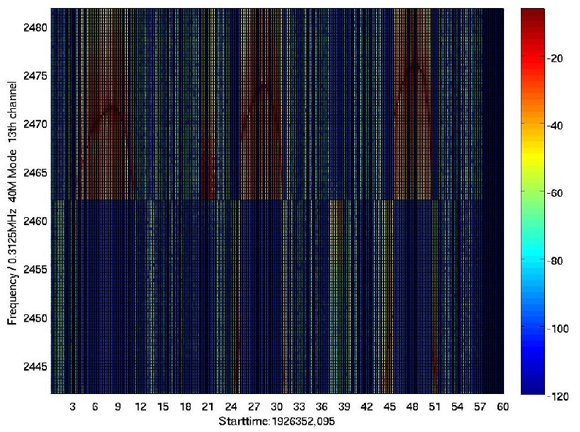
Fixed-frequency devices
The frequency of fixed-frequency devices remains unchanged. Fixed-frequency devices include microwave ovens, wireless cameras, and wireless video and audio transmitters. In terms of occupied bandwidth, fixed-frequency devices are classified into broadband and narrowband devices.- Broadband devices: occupy a large bandwidth, such as microwave ovens which cover channels 11, 12, and 13. Figure 3 shows the realtime spectrum of a microwave oven (the horizontal axis indicates time whereas the vertical axis indicates frequency). In addition to bandwidth characteristics, the microwave oven also has obvious frequency scanning features, that is, the center frequency point drifts up and down.
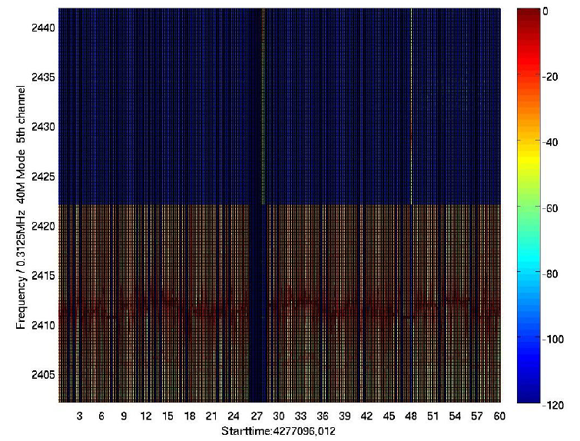
- Narrowband devices: occupy a small bandwidth, such as wireless cameras, wireless video and audio transmitters, and baby monitors. Figure 4 shows the realtime spectrum of a baby monitor (the horizontal axis indicates time whereas the vertical axis indicates frequency).