Usage of Debugging Commands
This section describes basic principles of debugging information, operation procedure for outputting debugging information, and how to disable debugging after debugging is complete.
Overview
Debugging information is the traced information about internal running states of equipment and can be output to terminals. Debugging commands are an important tool used by the network administrator or system maintenance engineers to maintain equipment and locate faults.
- During routine system maintenance, the network administrator or system maintenance engineers can run the ping and tracert commands to check the network connectivity.
- During routine system debugging, the network administrator or system maintenance engineers can run debugging commands to output debugging information and locate faults in the system based on debugging information. Huawei data communications equipment provides a complete debugging command set to facilitate equipment maintenance.
Basic Principles
Huawei data communications equipment provides diversified debugging functions. For a majority of protocols and functions supported by the equipment, the system provides related debugging information to help users diagnose and locate faults.
Format of debugging information
Debugging information consists of the following fields:
Timestamp Sysname Module/Level/Digest: Content
For example:
Sep 2 2011 10:21:56.390.3-08:00 HUAWEI RSVP/7/HELLO: 008:00569: Receiving Hello REQ Message from Nbr 10.1.2.2! Src_Instance : 0x11029428 Dst_Instance : 0x10FA2258Fields of debugging information are described as follows:
Timestamp
This field records the time that debugging information is generated so that users can view and locate system events.
Sysname
This field indicates the name of the system. The network administrator or system maintenance engineers can run the sysname command to modify the system name.
Module
This field indicates the name of the functional module that generates debugging information.
Level
Debugging information is of eight levels from level 0 to level 7. The level of debugging information generated by each module has been already determined at the development phase.
Digest
This field is a phrase that outlines debugging information.
Content
This field is the detailed description about debugging information. The digest must be separated from the content by a colon (:). If a lot of information needs to be displayed, the information is displayed in multiple lines.
System debugging
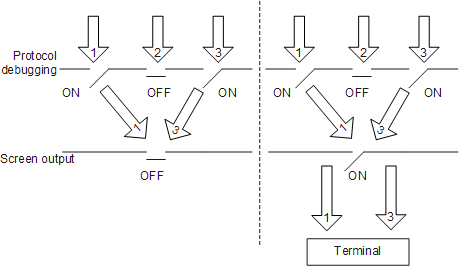
Two types of debugging are used to control the output of debugging information:- The protocol debugging determines whether debugging information about a protocol is generated.
- The screen output determines whether debugging information is displayed on the screen of a specified user.
As shown in Figure 1, the system provides debugging information for modules 1 to 3. You must enable both the protocol debugging and the screen output to display debugging information on the terminal.
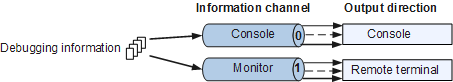
Information output direction
Debugging information is managed by the information center. Based on the association between the information channel and the output direction, the information center can output debugging information to different directions, as shown in Figure 2.
The console is a terminal that is directly connected to the equipment through the Console port.
The monitor is a terminal that can remotely log in to the equipment by using protocols, such as Secure Shell (SSH) and Telnet.
Outputting Debugging Information

Debugging affects system performance. Enable debugging only when debugging information is required for fault location.
When you shut down the console or tear down the SSH or Telnet remote connection, the system automatically disables all debugging to ensure that the system is not affected in the case debugging is left enabled.
- Be cautious when using the debugging command that contains the keyword "all". You are advised not to use the debugging all command. After debugging is complete, run the undo debugging all command to disable debugging immediately.
To enable the debugging of a specified module, run the debugging module command.
You can view the module name by entering the question mark (?) after the debugging command, for example, debugging ?.
To enable the screen output of debugging information.
Run the terminal debugging command to display debugging information on a console.
By default, when debugging information is output to a console, terminal monitor is in the enabled state. Therefore, you do not need to run the terminal monitor command.
Output debugging information to a monitor.
- Run the terminal debugging command to display debugging information on a terminal.
- Run the terminal monitor command to display debugging information on the monitor.
By default, when debugging information is output to a monitor, terminal monitor is in the disabled state. Therefore, you need to run the terminal monitor command.
Run the undo debugging command to disable debugging.
If all debugging tasks are complete, you can directly run the undo debugging all command to disable all debugging.

In this document, commands used for debugging specified modules or protocols are provided as examples, and commands used for outputting debugging information to terminals are not provided.