Spectrum Analysis
Context
The AP3010DN-AGN and AP9330DN do not support this function.
On the Spectrum Analysis page, you can enable or disable the spectrum analysis function on a radio and view spectrum charts. The Spectrum Analysis page can display eight types of spectrum charts, including Swept Spectrogram, Active Devices, Real-Time FFT, Channel Metrics, Channel Quality Trend, FFT Duty Cycle, Interference Power, and Quality Spectrogram.
Type |
Icon |
Description |
|---|---|---|
Swept Spectrogram |
|
Swept Spectrogram displays RSSI distribution of one or all channels within valid collection intervals. It can reflect the spectrum characteristics of a specific device. For example, frequency modulation (FM) devices feature instantaneous frequency deviation, such as cordless phones, Bluetooth devices, and wireless game controllers. On Swept Spectrogram, the horizontal coordinate indicates the channel frequencies, and the vertical coordinate indicates the time (with the latest time displayed at the bottom). The color brightness indicates the RSSI strength. The colors blue, green, cyan, yellow, and red indicate the RSSI strength in ascending order. |
Active Devices |
|
Active Devices displays non-Wi-Fi interference devices identified by the AP. Currently, the AP can identify baby monitors, Bluetooth devices, digital cordless phones (at 2.4 GHz frequency band only), wireless audio transmitters, wireless game controllers, and microwave ovens. Due to spectrum differences of individual APs, some of these non-Wi-Fi devices may not be identified. Active Devices can be displayed as a pie chart (default)
or table. You can click Active Devices provides the following information:
|
|
||
Real-Time FFT |
|
Real-Time FFT displays the RSSI values of one or all channels within valid collection intervals. On Real-Time FFT, the horizontal coordinate indicates the channel frequencies, and the vertical coordinate indicates the RSSI values. |
Channel Metrics |
|
Channel Metrics can be displayed
as a bar chart (default) or table. You can click Channel Metrics provides the following
information:
|
|
||
Channel Quality Trend |
|
Channel Quality Trend displays the quality trends of channels. Channel quality = 1 - Sum of duty cycle of each interference source On Channel Quality Trend, the horizontal coordinate indicates the time, and the vertical coordinate indicates the channel quality. Channels are distinguished by the color. |
FFT Duty Cycle |
|
FFT Duty Cycle displays duty cycle information about each frequency within a valid collection interval (60s). Duty cycle indicates the ratio of the time segment t during which the RSSI value is 20 dB higher than the predefined noise value to the entire collection interval T. On FFT Duty Cycle, the horizontal coordinate indicates frequencies, and the vertical coordinate indicates the duty cycle. |
Interference Power |
|
Interference Power displays the real-time interference strength of channels. On Interference Power, the horizontal coordinate indicates channels, and the vertical coordinate indicates the interference signal strength. Interference types are distinguished by the color. |
Quality Spectrogram |
|
Quality Spectrogram displays the quality of one or all channels within valid collection intervals. Channel quality = 1 - Sum of duty cycle of each interference source On Quality Spectrogram, the horizontal coordinate indicates the channel frequencies, and the vertical coordinate indicates the time (with the latest time displayed at the bottom). The color brightness indicates the channel quality. The colors blue, green, cyan, yellow, and red indicate the channel quality in ascending order. |


Procedure
- Enable spectrum analysis on a radio and view spectrum charts.
Choose . The Radio List page is displayed.
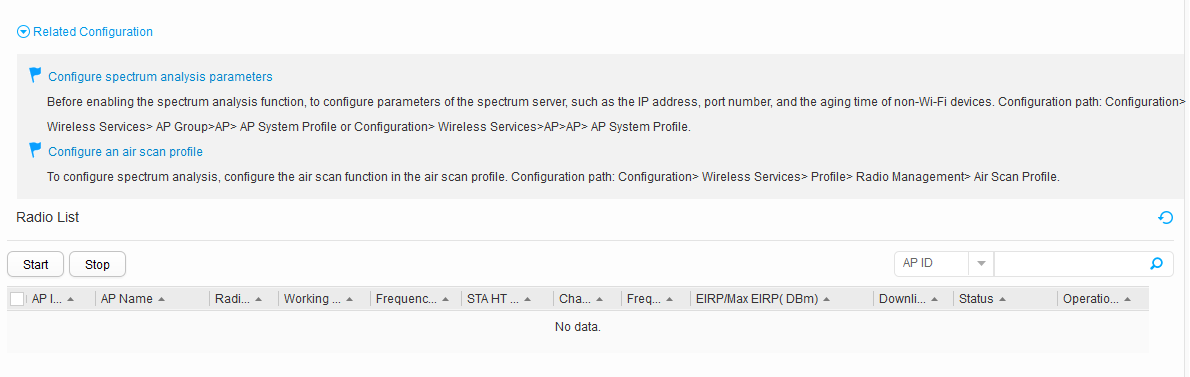
Table 2 Parameters on the Radio List page Parameter
Description
AP Name
AP name.
AP ID
AP ID.
Radio ID
Radio ID of an AP.
Working Mode
Working mode of a radio.
Frequency Band
Frequency band on which a radio works.
STA HT Mode
Radio type.
Channel
Working channel of a radio.
Frequency Bandwidth
Channel bandwidth of a radio.
EIRP/Max EIRP
Radio power configured/Maximum power in compliance with local laws and regulations.
Downlink Packet Loss Ratio
Packet loss ratio on a radio.
Status
Whether to enable the spectrum analysis function on a radio.
Operation
Radio spectrum chart display by clicking View Drawing.
In the AP radio list, click View Drawing in the Operation column. The related spectrum charts are displayed. A maximum of four spectrum charts can be displayed.
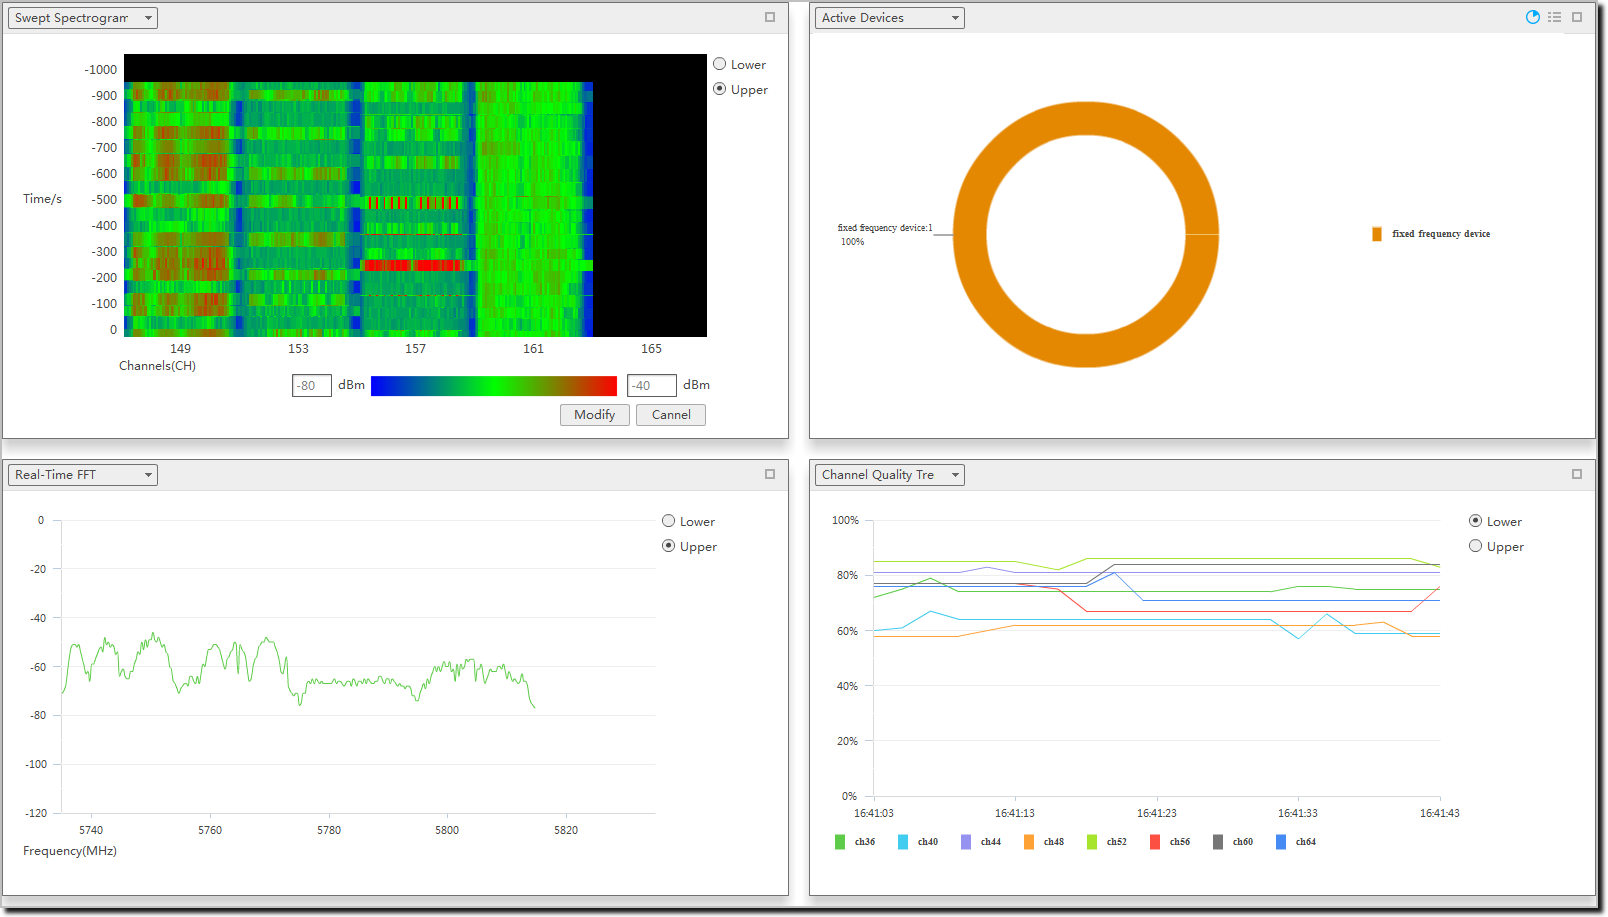
Select your desired spectrum chart from the drop-down list box in the upper left corner. Particularly, you can select Lower or Upper on the spectrum charts of a 5G radio to view spectrum charts of different frequencies.
- On the Swept Spectrogram chart, click Modify, set the signal strength scope at both ends of the color bar, and click Apply.
On the Active Devices chart, click
 . The detected non-Wi-Fi
devices are displayed in a list. Click
. The detected non-Wi-Fi
devices are displayed in a list. Click  . The detected non-Wi-Fi devices are displayed
in a pie chart.
. The detected non-Wi-Fi devices are displayed
in a pie chart.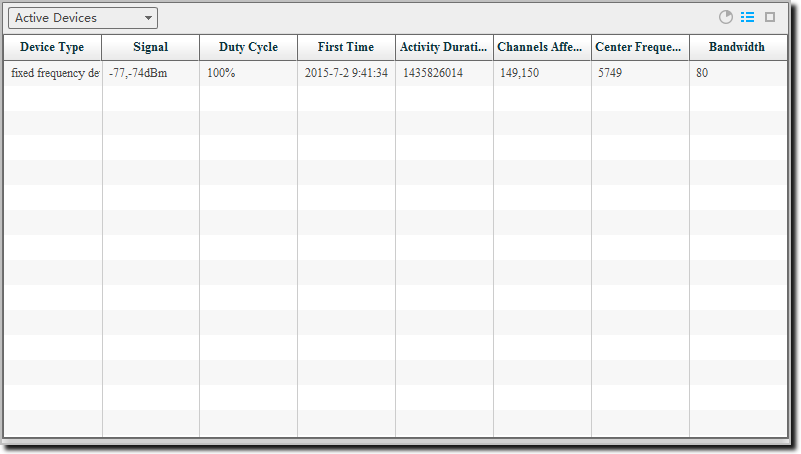
Table 3 Parameters in the non-Wi-Fi device list Parameter
Description
Device Type
Type of the detected non-Wi-Fi device.
Signal
RSSI of the non-Wi-Fi device.
Duty Cycle
Duty cycle of the non-Wi-Fi device.
First Time
Time when the non-Wi-Fi device is detected.
Activity Duration
Time when the non-Wi-Fi device is activated.
Channel Affected
Channel interfered by the non-Wi-Fi device.
Center Frequency
Center frequency of the non-Wi-Fi device.
Bandwidth
Bandwidth of the non-Wi-Fi device.
- Disable spectrum analysis on a radio.