Trap Implementation Principle
Overview
When faults occur or the system operates abnormally, alarms and events are triggered to help users detect and locate faults quickly.
Event
Events are triggered by specific occurrences, and indicate anything that takes place on a managed object in the system. For example, an object is added, deleted, or modified.
Events are recorded in logs (including operation, security, event, diagnostic logs, and maintenance logs). Certain events may trigger traps that are called event traps and shall be paid attention to or processed by users immediately. An event trap does not have a match trap.
Alarm
Alarms are triggered when the device operation is abnormal, causing the service to be abnormal or disabling the device from properly working. Alarms require immediate attention or processing of users. They inform maintenance personnel of the device operating state and assist in fault location. For example, the change of the interface status may trigger an alarm.
When a fault occurs, an alarm is triggered and the alarm trap is sent. After the fault is rectified, the alarm status changes from active to cleared and the clear alarm trap is sent. If an alarm trap is generated, a corresponding clear alarm trap will be generated after the fault is rectified. These two traps are a match and both called alarm traps.

By default, alarms and events are defined by the Huawei NMS. Alarms and events may be defined differently on third-party NMSs, but can be redefined as required.
Information Output
Information generated by the device can be output to the remote terminal, console, log buffer, log file, and SNMP agent. To output information in different directions, 10 information channels are defined for the information center. These channels work independently from one another. You can configure output rules so that information can be output from different objects to different objects based on types and severities, as shown in Figure 1.
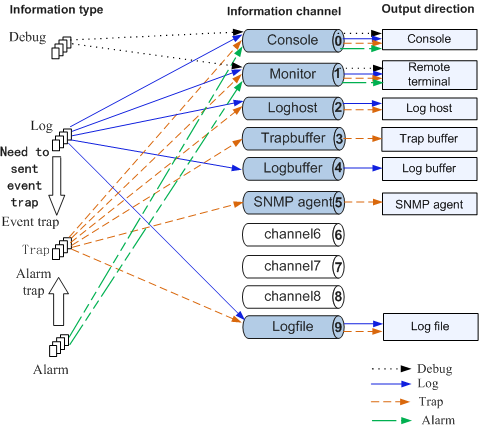
- For log information, an event trap is triggered only when an event that triggers trap sending generates a log.
- For alarm information, an alarm trap is triggered as long as alarm information is generated.
Output Directions |
Description |
|---|---|
Log file |
Records all information generated by the device. Saved as a .zip file on the hard disk or flash memory of a device. |
Simple Network Management Protocol (SNMP) agent |
If an NMS is configured, the system sends the traps to the NMS by the Simple Network Management Protocol (SNMP). |
Log buffer |
Records all log information generated by the device. For alarms, information recorded in the log buffer is the same as that recorded in the trap buffer. |
Trap buffer |
Records trap information after the trap function is enabled using the snmp-agent trap enable command. Its size can be allocated as required. |
Log host |
Records all log information generated on the device. Information is saved in files on the log host and can be accessed as you want. |
Remote terminal |
Outputs all information to the VTY terminals for remote maintenance. |
Console |
Outputs all information to the local console. |
Trap Generation Mechanism and Output Format
Alarm
Figure 2 Mechanism for the Input and output of the alarm information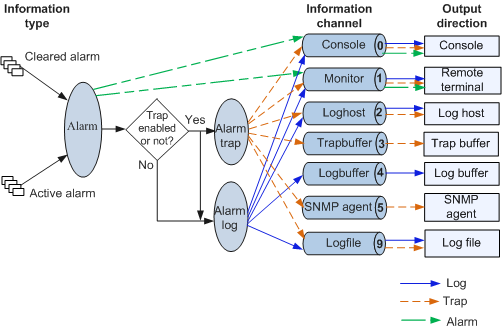
Alarms are outputted in different forms, and their information formats are also vary, as shown in Table 2.
Table 2 Format for the output of the alarm information Information Form
Output Direction
Information Format
Alarm
Remote terminal or console
#265/active/mplsLdpSessionDown/Critical/occurredTime:2015-08-07 12:44:01/-/-/alarmID:0x09020000/CID=0x801c043c:
The LDP session status is Down. (PeerLsrId=19.19.19.19:0, VrfName=_public_, SessionType=Local, IfName=GigabitEthernet0/1/1, SubReason=0,
Reason=The LDP Keepalive timer expired.)
Figure 3 Alarm format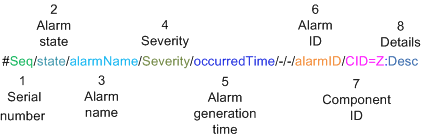
Alarm information is displayed on the terminal screen through the Monitor or Console channel. The format of alarm information displayed on the screen is different from that of the alarm log recorded in the log buffer and of the alarm trap recorded in the trap buffer. However, the information content is the same.
NOTE:An alarm ID uniquely identifies an alarm. You are advised to locate the description and handling procedure of an alarm by searching for its ID in the manual.
Alarm trap
Trap buffer
Aug  7 2015 12:44:01 HUAWEI %%01LDP/1/Session-Down-MIB(t):CID=0x801c043c-OID=1.3.6.1.2.1.10.166.4.0.4;
The LDP session status is Down. (PeerLsrId=19.19.19.19:0, VrfName=_public_, SessionType=Local, IfName=GigabitEthernet0/1/1, SubReason=0,
Reason=The LDP Keepalive timer expired.)
Figure 4 Alarm trap format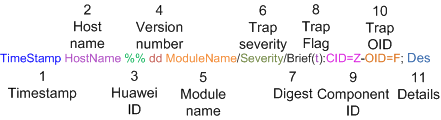
The alarm trap is also displayed on the terminal screen through the Monitor or Console channel. The format of the information displayed on the screen is the same as that of the alarm trap recorded in the trap buffer.
This manual mainly describes traps recorded in the trap buffer. For details, see Descriptions of Traps in the Trap Buffer.
Alarm log
Log buffer
Aug  7 2015 12:44:01 HUAWEI %%01LDP/1/mplsLdpSessionDown_active(l):CID=0x801c043c-alarmID=0x09020000;
The LDP session status is Down. (PeerLsrId=19.19.19.19:0, VrfName=_public_, SessionType=Local, IfName=GigabitEthernet0/1/1, SubReason=0,
Reason=The LDP Keepalive timer expired.)
Figure 5 Alarm log format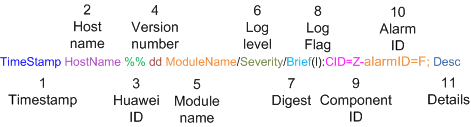
The alarm log is also displayed on the terminal screen through the Monitor or Console channel. The format of the information displayed on the screen is the same as that of the alarm log recorded in the log buffer.
Logs recorded in the log buffer can be located in the log reference through the information digest.
Event
All events are recorded in logs, and only events that trigger trap sending trigger event traps. In this case, the corresponding log is not recorded in the log buffer.
Event that triggers trap sending
Figure 6 Input and output mechanism for an event that triggers trap sending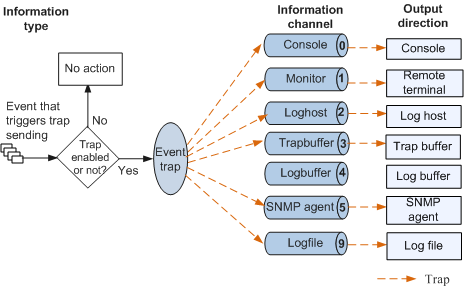
Events that trigger trap sending are saved as event traps and outputted through different information channels but in the same information format (except for the SNMP agent). Figure 7 shows the information format.
For example, an event trap displayed on the screen is as follows:
Aug 17 2015 21:27:58 HUAWEI %%01MSTP/4/hwMstpProRootChanged(t):CID=0x8054042c-OID=1.3.6.1.4.1.2011.5.25.42.4.2.17;
The root bridge of MSTP process changed. (ProcessID=0,InstanceID=0, PortID=2)
This manual mainly describes traps recorded in the trap buffer. For details, see Descriptions of Traps in the Trap Buffer.
Event that does not trigger trap sending
Figure 8 Input and output mechanism for an event that does not trigger trap sending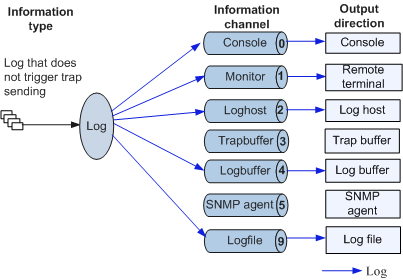
Events that do not trigger trap sending are saved in event logs. Figure 9 shows the information format.
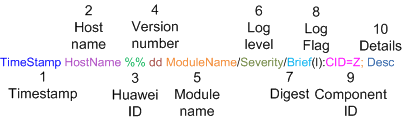
The formats of the logs that the terminal screen, log host, log file, and log buffer display are the same. For example, an event log displayed on the terminal screen is as follows:
Aug 17 2015 21:16:38 HUAWEI %%01OSPF/3/NBR_DOWN_REASON(l):CID=0x80830436;Neighbor state left full or changed to Down.
 (ProcessId=65534, NeighborRouterId=192.168.1.1, NeighborIp=10.1.1.1, NeighborAreaId=0.0.0.0,NeighborInterface=-,NeighborDownImmediate
reason=Neighbor Down Due to Kill Neighbor, NeighborDownPrimeReason=Link Fault or Interface Configuration Change,CpuUsage=0%)
Logs recorded in the log buffer can be located in the log reference through the information digest.