TWAMP Light Application in Eth-Trunk Member Interface-based Measurement Scenarios
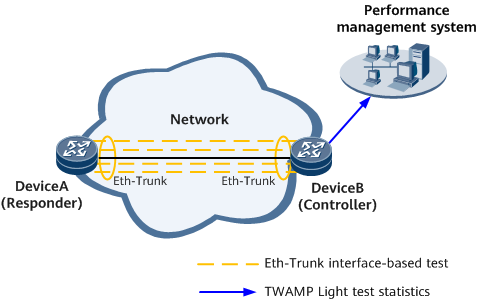
As shown in Figure 1, the link between DeviceA and DeviceB consists of multiple bundled Eth-Trunk member links. When the performance of the Eth-Trunk member links needs to be tested, the Controller and Responder must be directly connected. In this case, DeviceA serves as the Responder and is directly connected to DeviceB. DeviceA reflects the packets of the test session. DeviceB functions as the Controller to send and receive test session packets, collect and calculate performance statistics, and send the statistics to the performance management system.
You can deploy TWAMP Light as follows:
- Configure the Controller as the Control-Client, create a test session, and bind the test session to an Eth-Trunk interface.
- Create a test session with the same ID on the Responder and bind the session to an Eth-Trunk interface.
- Specify the Controller as the Session-Sender to initiate a performance measurement test so that the Controller sends TWAMP test packets to the Responder.