Understanding TWAMP
Implementation
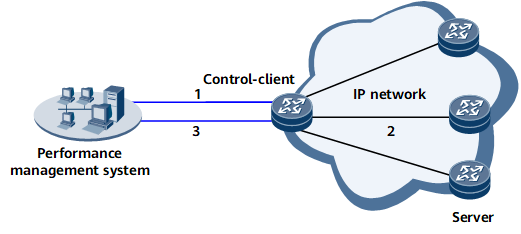
The Two-Way Active Measurement Protocol (TWAMP) defines a method for measuring round-trip IP network performance between two TWAMP-capable devices. Figure 1 Figure 1 shows how TWAMP is implemented.
- The performance management system instructs the control-client to establish a test session with a specific TWAMP server.
- The control-client establishes and completes the test session.
- The performance management system collects and saves statistics during the test. The statistics of on-demand measurement are reported through SNMP (MIBs), and the statistics of proactive measurement are reported through the PM module.

TWAMP supports only proactive measurement.
Intercommunication Model
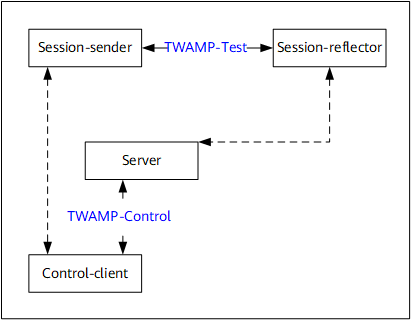
- Control-client: establishes, starts, and stops a test session and collects statistics.
- Session-sender: proactively sends probes for performance statistics after being notified by the control-client.
- Server: responds to the control-client's request for establishing, starting, or stopping a test session.
- Session-reflector: replies to the probes sent by the session-sender with response probes after being notified by the server.
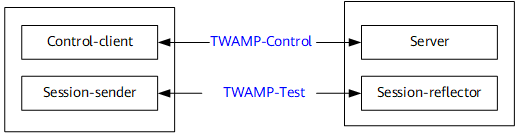
To facilitate implementation, TWAMP unifies the four logical entities, as shown in Figure 3. Control signals are exchanged between the control-client and server through a TCP connection; probes are exchanged between the session-sender and session-reflector through a UDP connection. The control-client and server establish and start a test session. Once a test session starts, the control-client and server notify the session-sender and session-reflector respectively of the session information and allow the session-sender to send probes and the session-reflector to respond to the probes.
On a live network, if a network element (NE) functions as a server and session-reflector alone, the NE participates in TWAMP session establishment and probe exchanges but does not compile statistics. If a device or tester functions as the control-client and session-sender, the device or tester proactively establishes a TWAMP session for statistics collection. Users manage the control-client alone to rapidly obtain statistics about the performance of the entire IP network.
Measurement Indicators
- Latency: is calculated based on the timestamps carried in probes. The session-sender sends a probe carrying the transmit timestamp t1, and the session-reflector replies with a response probe carrying the receive timestamp t1' and the respond timestamp t2'. Upon receipt of the response probe, the session-sender records the receive timestamp t2. The latency during a single round trip is then calculated as follows:
- Jitter: is the absolute deviation between two latencies in two consecutive round trips. According to the preceding formula, the latency in the next round trip is Latency2 = t4 – t3 – (t4' – t3'). The jitter is then calculated as follows:
- Packet loss rate: calculated based on the number of packets sent and received by the Sender. For example, if the number of packets sent by the Sender is P1 and the number of packets received by the Sender is P2, the packet loss rate is calculated as follows: